| The following passage is a healthy prescription (处方) of how we can approach life. It is not about being famous or being wealthy or about our good looks. Truly, it is all about love. There are times when we feel as if we are separated from the rest. This feeling creates a mental prison. Therefore, we should try to work hard to internally (内在地) liberate ourselves by widening our circle of pity to accept all living things. “Open your heart to others and try to understand, When someone reaches for you, hold out to them your hand, Follow your heart, no matter what other people say, Do things that make you able to smile throughout your day, Treat other people, the way you would like them to treat you, Do what you know is right and to your heart and self stay true, Remember what life is all about, it is how you make people feel, What you do, where you go, and making dreams become real, Helping people through, in hard times of pain and strife, What you do for others, is what is important in this life. Look deeper and don’t judge people by what is on the outside, It is what is inside that counts and what people often hide, Care, help, love, be honest, and be kind, With purity and goodness within yourself, it is happiness you will find. Do all you can in the time you have, you won’t always be around, Recapture the joy of little things, that once were easily found, And if you can do all this and live a life of love, You will be helped through life, by all those up above.” I will leave you with the inspiring words of our late genius, Albert Einstein: “There are two ways to live life. One is as though nothing is a miracle(奇迹). The other is as though everything is a miracle.” 60. The passage is mainly about ______. A. living a life of love B. helping those in need C. taking back the joy of life D. separating ourselves from others 61. According to the passage, which statement is true? A. Treating others the way others treat you is right for your life. B. Making your dream become real is selfish in your life. C. Judging people by what is inside counts. D. Doing what you can makes yourself happy. 62. The underlined sentence in the last paragraph probably means _________. A. Different ways of life lead to completely different results B. Life is not always full of miracles C. There are two kinds of miracles in life D. Looking for miracles in life helps people find happiness |  题目内容
(请给出正确答案)
题目内容
(请给出正确答案)
 简答题官方参考答案
(由简答题聘请的专业题库老师提供的解答)
简答题官方参考答案
(由简答题聘请的专业题库老师提供的解答)

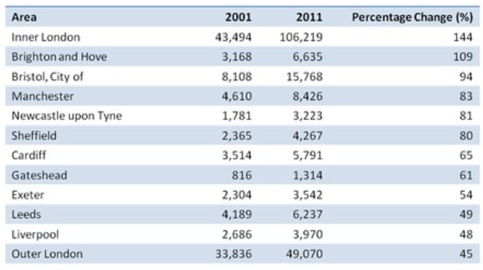 (9.) ____________ Overall, the number of UK commuters who travelled to work by bicycle rose considerably over the 10-year period. Inner London had by far the highest number of cycling commuters in both years. In 2001, well over 43 thousand residents of inner London commuted by bicycle, (10.) ____________, an increase of 144%. By contrast, although outer London had the second highest number of cycling commuters in each year, the percentage change, at only 45%, (11.) ___________. Brighton and Hove saw the second biggest increase (109%) in the number of residents cycling to work, but Bristol was the UK’s second city in terms of total numbers of cycling commuters, with 8,108 in 2001 and 15,768 in 2011. (12.) ___________. (13.) ___________. A. and this figure rose to more than 106 thousand in 2011 B. Other 8 cities, though not so high as the previous two cities, still demonstrate much changes, with the percentage ranging from 48%-94%. C. The table compares the numbers of people who cycled to work in twelve areas of the UK in the years 2001 and 2011. D. Here is the description of the chart on the paper. E. was the lowest of the twelve areas shown in the table F. This change of preference for bicycle as a means of transportation shows people’s awareness of environmental protection, which should be encouraged by the society. 现在请填写第9题答案。(填一个大写字母即可)